Every sport has its all-time greats, those who have defined the sport by their passion, skill, commitment and natural gift. We take a look at baseball’s best players for each position and those that come closely behind them. There is no specific time period considered for this evaluation but rather a general look over the entire history of the sport.
1. George Brett
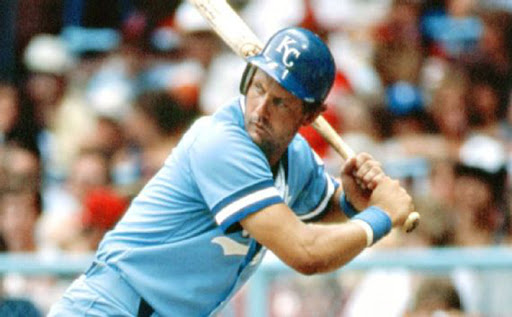
This was Kansas City Royals’ designated hitter and third baseman. At 3,154 hits, Brett holds the record for the most hits made by a third baseman in the history of the league. This is also the 16th highest number of hits by a baseball player since the inception of the sport. Brett is also among the only four players in Major League Baseball to exceed the 3,000 mark in hits. The rest are Stan Musial, Willie Mays and Hank Aaron.
2. Mariano Rivera
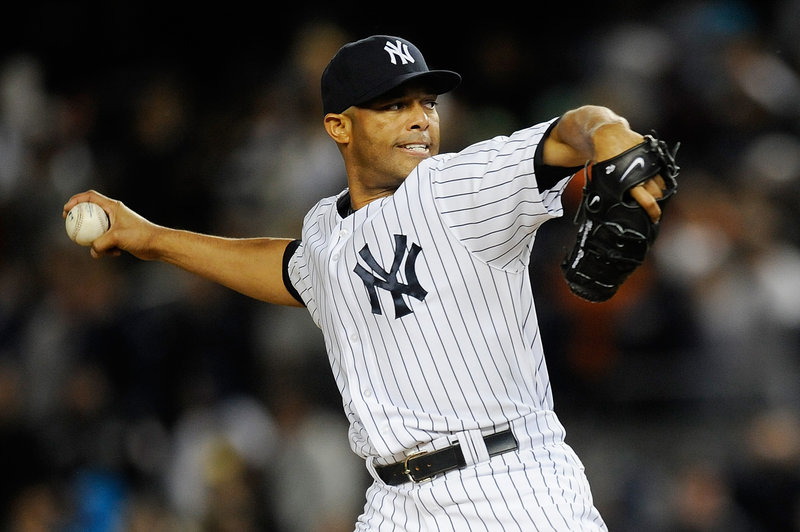
Rivera was a Panamanian-American who played as a pitcher for the New York Yankees. He played a total 19 seasons and became a 13-time all star. Rivera holds the MLB’s records for career saves at 652. During his tenure with the Yankees, Rivera won three delivery man of the year awards and five American League awards. He also finished within the top three of those competing for the CY young awards.
3. John McGraw
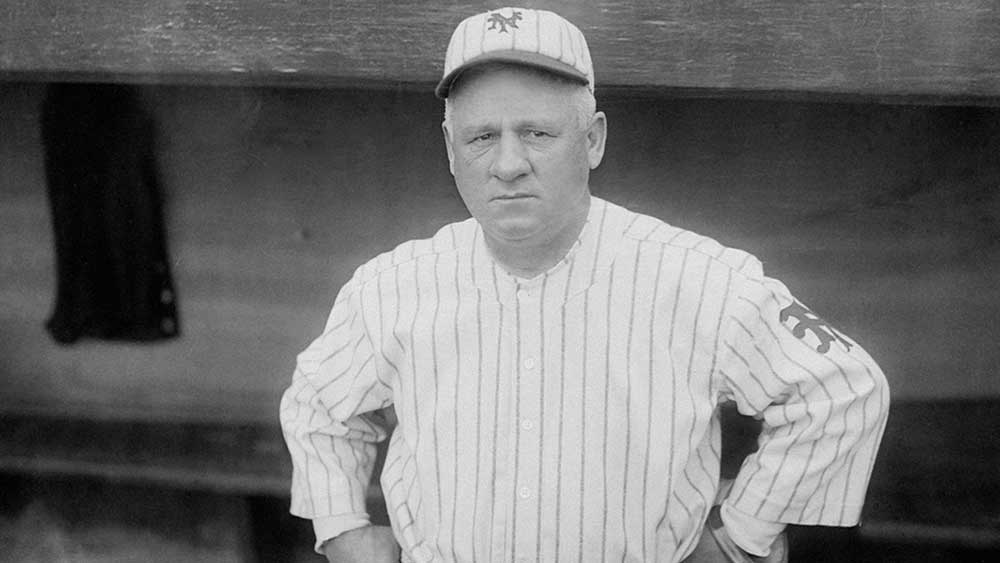
Nicknamed Mugsy or Little Napoleon, McGraw was a MLB player who played for the Baltimore Orioles and later managed the New York Giants. However, John is best known for his managerial success more than the success he enjoyed as a player. He is best remembered for his 2,673 victories and 2,669 in the senior circuit of baseball. McGraw retired from baseball in 1932.
4. Vin Scully
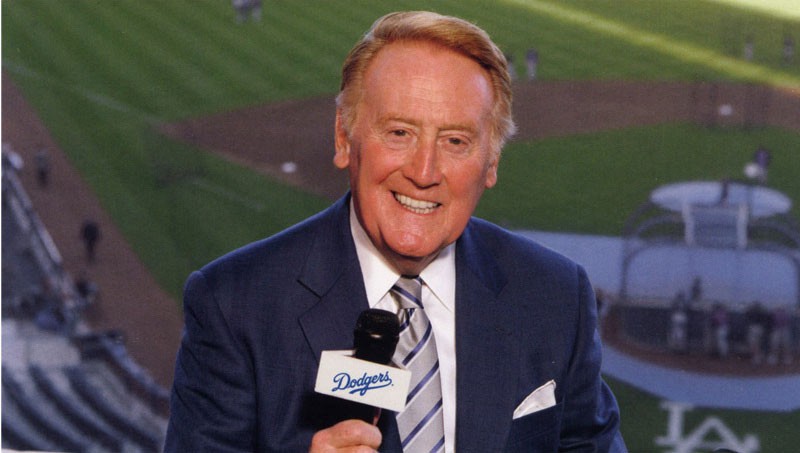
Scully was born in 1927 and started his baseball career sport casting with the Los Angeles Dodgers in 1950. Hs career ran from 1950 through 2016, the longest of any sportcaster in the MLB. He was best known for his lyrical signature style to broadcasting and introduction of the dodgers’ games. At the start of his career, the Dodgers were still based in the city of Brooklyn.
5. Lefty Grove
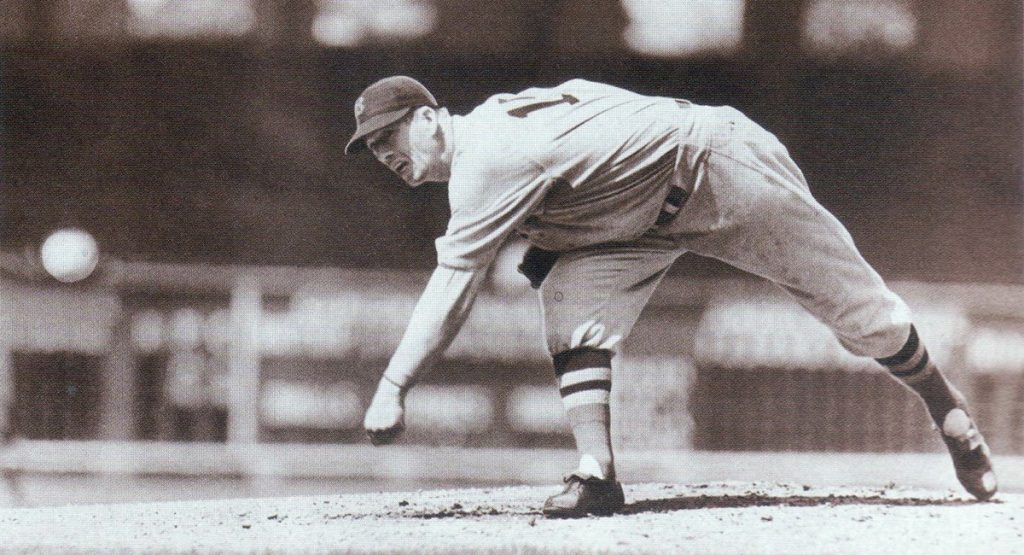
Born Robert Grove in the year 1900, Lefty was a baseball pitcher playing for Philadelphia Athletics and the Boston Red Sox. He is considered to be the MLB’s all-time greatest left handed pitcher. Lefty holds the record for in strikeouts, wins over separate seasons and the lowest earned run average. In three years starting 1929, th4e player won the Triple Crown twice.
6. Babe Ruth
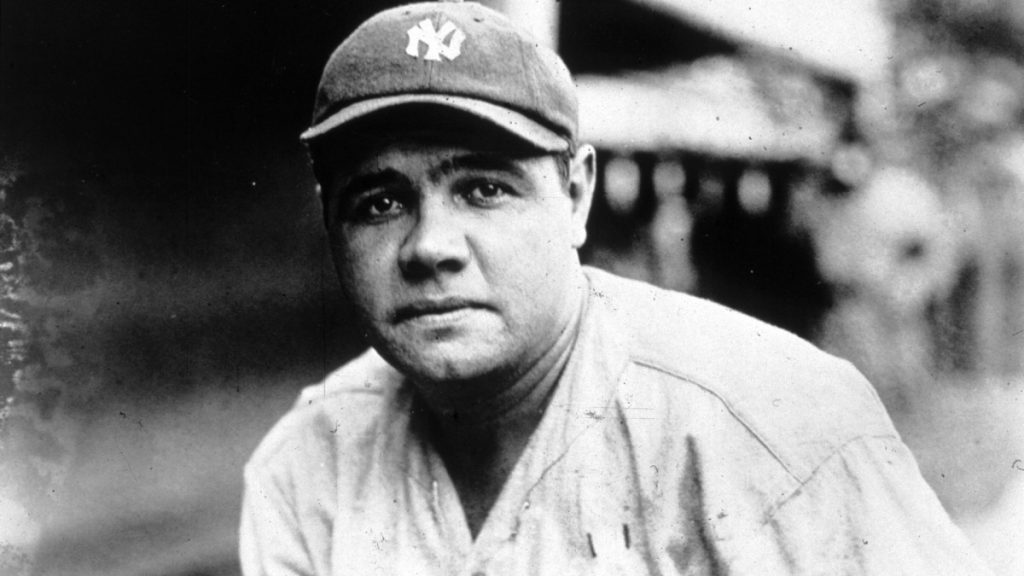
Born George Herman Ruth in 1895, Babe holds the MLB records for home runs, runs batted in, bases on balls, slugging percentage and on-base plus slugging. He is widely regarded as the sport’s greatest player and was elected into the hall of fame as one of the five first players. Ruth played for the Boston Red Sox as a pitcher and for the New York Yankees as a slugging outfielder. He achieved his legendary status with the latter due to his incredible slugging percentage.
7. Ted Williams
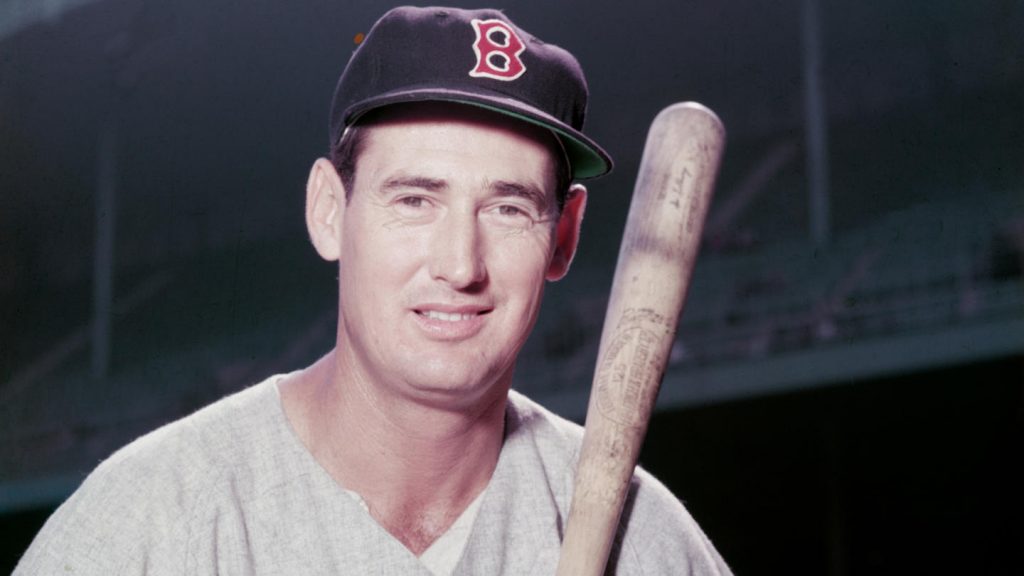
Ted was a professional baseball player and a manager in his later years. He played as a left fielder for the Boston Red Sox. Williams ranks very high among the greatest baseball players who ever lived. He was even fondly nicknamed as the greatest hitter who ever lived. He won the all-star award a record nineteen times amongst other awards such as the American League and the MVP award. He earned an average .344 batting average throughout his career.
8. Honus Wagner
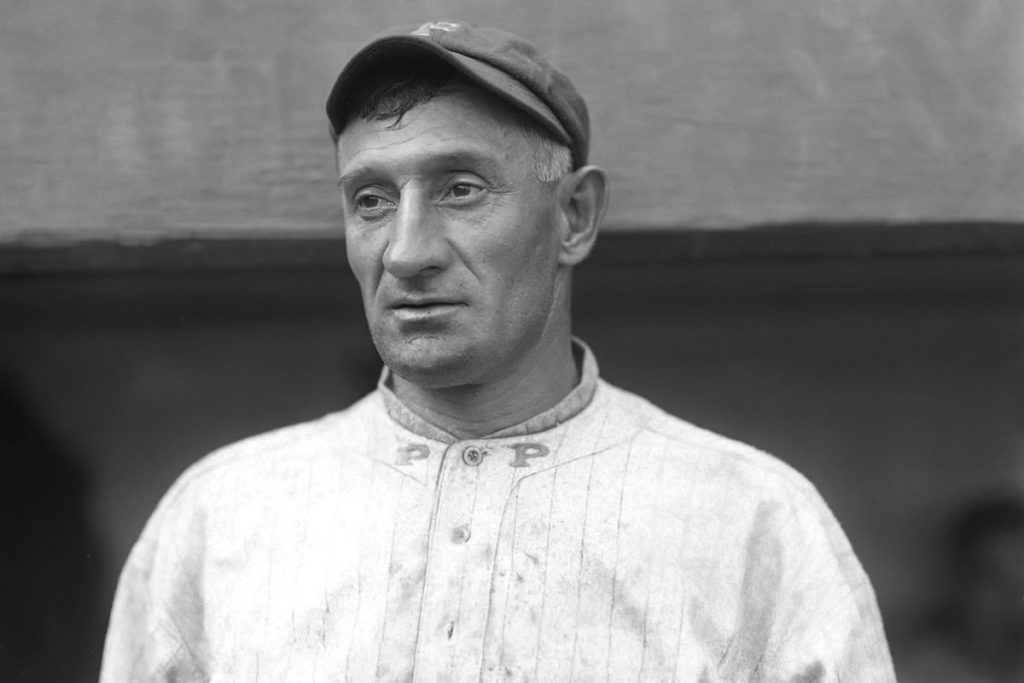
Wagner is probably to date America’s ever finest shortstop. He played through 21 seasons for the Pittsburgh Pirates. He won 8 batting titles and was the top slugger six times. He was nicknamed the flying Dutchman due to the combination of his German roots and playing speed. Together with the likes of Babe Ruth, Wagner was inducted into Baseball’s hall of fame among the very first five players to be inducted.
9. Yogi Berra
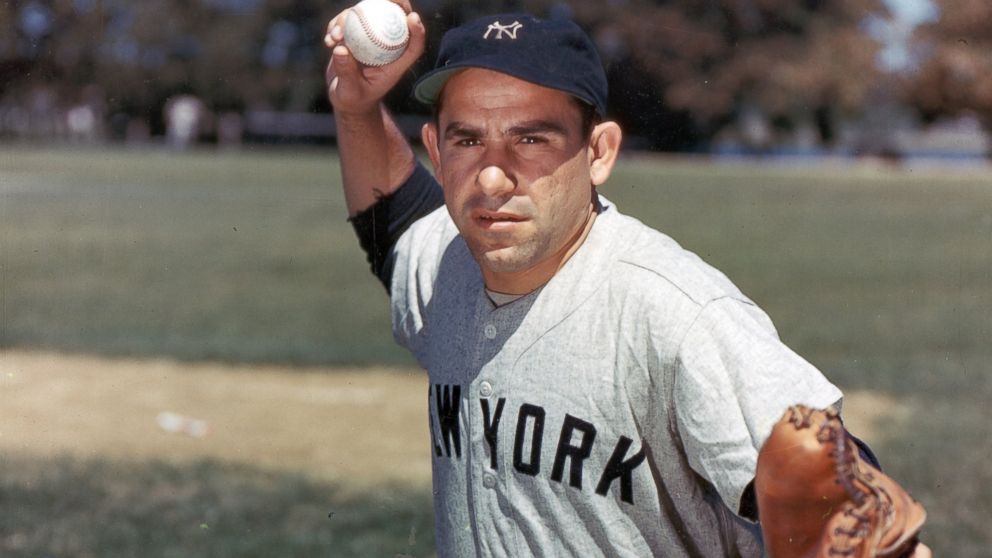
Born as Lawrence Peter Berra in the year 1925, Yogi was a professional catcher having played with the New York Yankees. He won the all-star award 18 times, just one shy of Ted Williams. He also won a record 10 World Series championships. He is widely considered among baseball’s greatest players and was inducted into the hall of fame in the year 1972.
10. Lou Gehrig
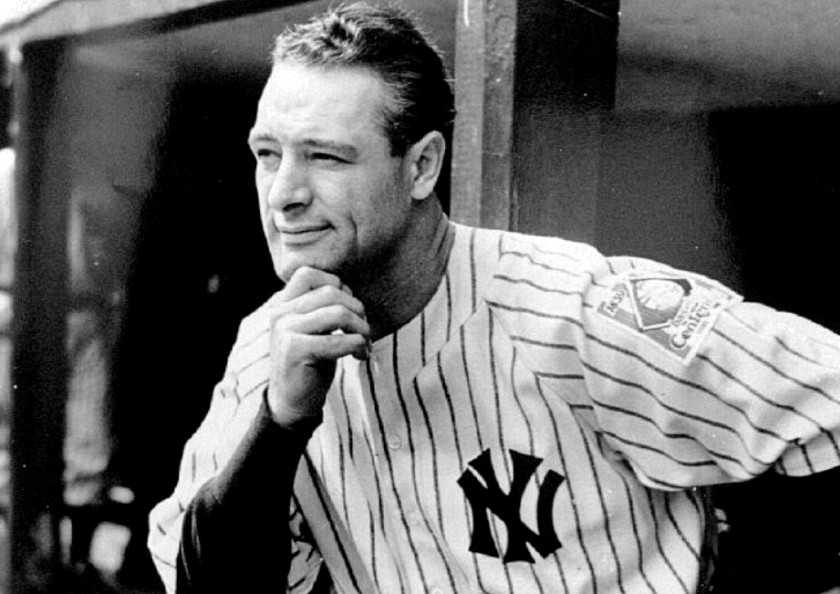
Lou played for 17 seasons with the New York Yankees starting in 1923. He was nicknamed the iron horse for his durability. He won the all-star award for seven consecutive times and once won the Triple Crown and the MVP award twice. He was inducted into the hall of fame in 1939 and became the first player to have his shirt number retired by the team.